Developing a Battery Energy Model for Electric Vehicles
Modelling electric vehicles (EV) performance and range is an important aspect in addressing fears of so-called range anxiety. Understanding battery performance is one of the more effective ways to do this. I explore the science (and equations) behind modelling battery State of Change (SoC) and how they are used in Drivecycle.
Recently I’ve been working on creating Drivecycle to determine EV battery State of Charge (SoC) and its applicability to public transit battery electric buses. With fixed routes, understanding the limitations of electric buses is important for maintaining public transit service. Along with creating a way to model drivecycles of routes, I also created a battery energy model that can be used to estimate SoC.
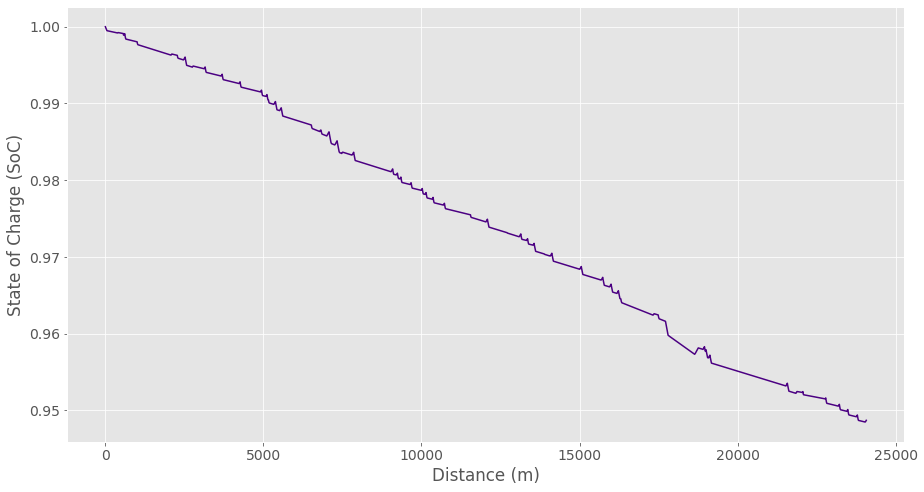
Example SoC - distance chart for a sample bus route developed using the Drivecycle python package.
There are two methods that I’ve come across in my research for effectively modelling the battery draw from a moving vehicle. I call these methods the current draw and power draw methods. There are advantages and disadvantages to each and I’ll provide some detail on how to use them. Apologies in advance - this post is going to be equation heavy!
Battery Basics
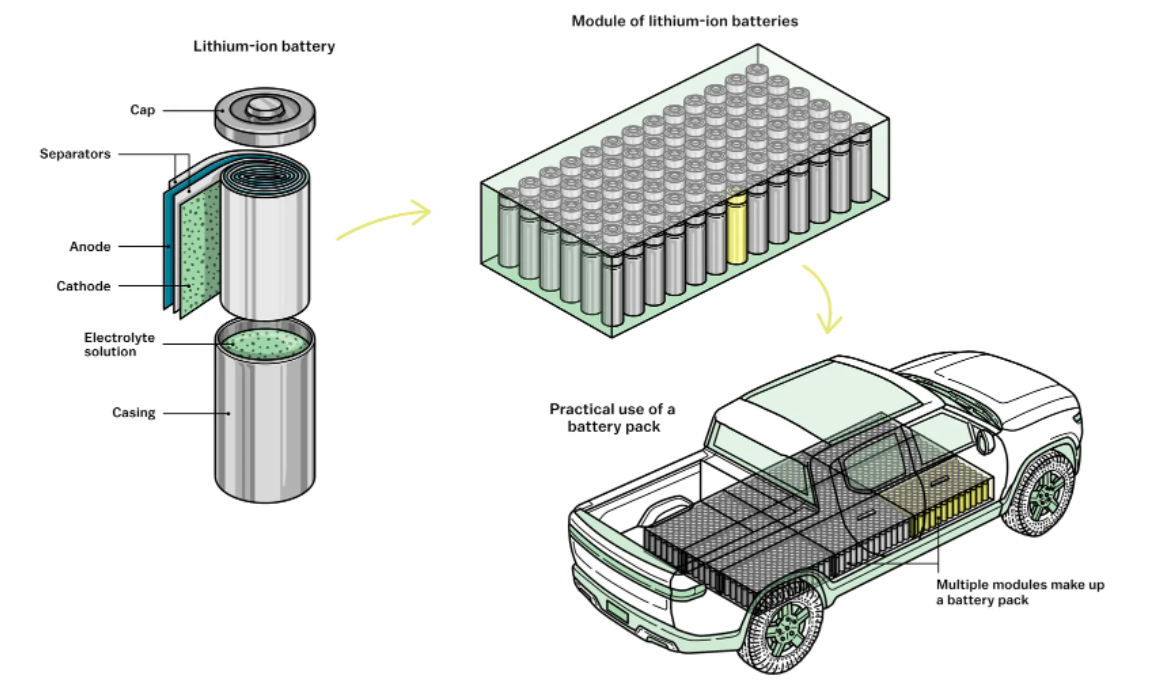
An electric vehicle battery pack is powered by many smaller lithium ion battery cells. (Source: Vox).
The battery pack of an electric vehicle is made up a of a number battery cells connected in series and/or parallel. Each battery cell has a nominal voltage which when combined in series will provide the voltage required to power the motor. The voltage is not constant when the battery is in use. When a current is drawn out, the voltage decreases and when the battery is charged, the voltage will rise. This model of a battery is best represented in its most fundamental form by an equivalent circuit as well as the following equation:
\[V = E - IR\]\(E\) is also called the Open Circuit Voltage (OCV) and \(V\) is the voltage at the terminals given an internal resistance \(R\) and current \(I\). OCV is the voltage when no current is flowing between the terminals. OCV is not constant and is dependent on a number of variables including state of charge of the cell, temperature and others.
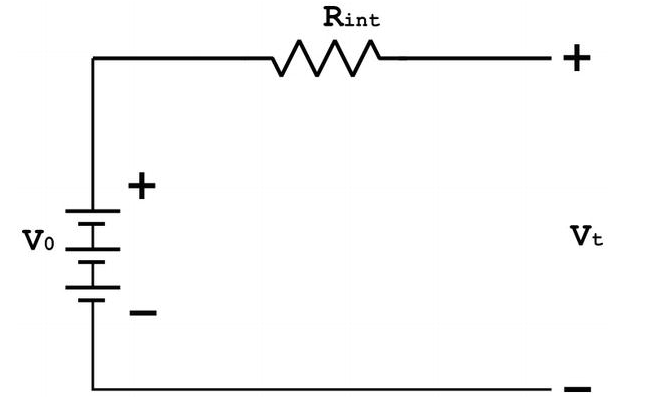
Simple equivalent circuit model for battery with a OCV, \(V_0\) and constant \(R_{int}\) (https://www.intechopen.com/chapters/78501).
Although the simple equivalent circuit model above approximates how a battery will operate, more refined models simluate dynamic operation of batteries.
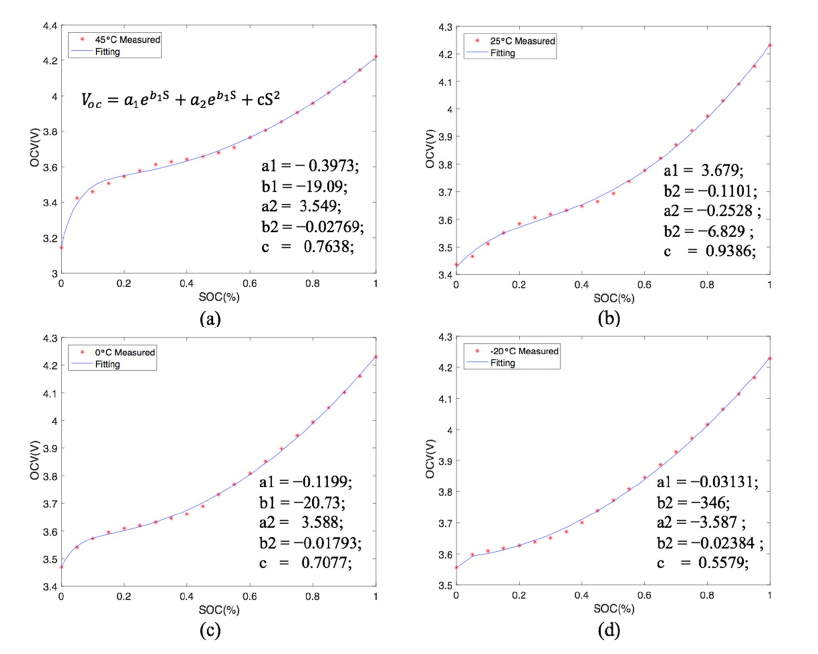 OCV vs State of Charge exponential model fitting curves for a lithium ion battery as completed by Zhang et. al, 2018.
Tractive Force
To determine SoC first we need to determine the tractive force that is needed to move the vehicle. This force is composed of component forces that include rolling resistance, aerodynamic drag, hill climbing and acceleration forces. Using the values from our driveycle \(v-t\) graph as well as the slope of the route we can easily determine the instantaneous tractive force of the vehicle.
Rolling Resistance Force, \(F_r = \mu \times m \times g\)
- \(\mu\), is the coefficient of rolling resisance
- \(m\), mass of the vehicle
- \(g\), is the gravitational acceleration constant
Aerodynamic drag force, \(F_{ad} = \frac{1}{2}\ \rho A C_d v^2\)
- \(\rho\), density of air
- \(A\), frontal area of vehicle
- \(C_d\), drag coefficient
- \(v\), velocity
Hill Climbing Force, \(F_h = m \times g \times sin(\alpha)\)
- \(\alpha\), grade of the slope
Acceleration Force, \(F_a = m \times a\)
- \(a\) acceleration of the vehicle
Total Tractive Force, \(F_t = F_r + F_{ad} + F_h + F_a\)
Motor Power
To determine the amount of power supplied by or to (i.e during regenerative braking) the battery we need to find out the power required by the motor. Taking into account the efficiencies of different components of the vehicle a simplified model may look like the following:
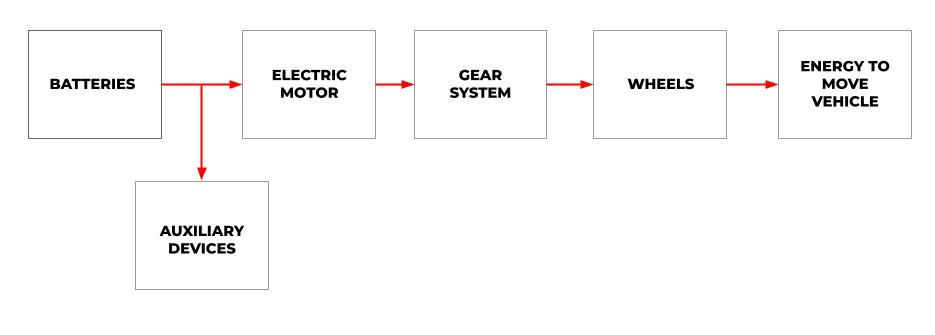 Simple energy flow model of an electric vehicle when the batteries are providing traction power. In a regenerative cycle, arrows from “Energy to move vehicle” to “Batteries” would be reversed.
We ultimately need to determine the torque and angular velocity at the motor as transferred from the wheel torque. This is found from the following formulas (Franca, 2015):
Torque at the wheel, \(T_w = F_t \times r_w\)
- \(r_w\) radius of wheel
Torque at the motor, \(T_m = {\dfrac{T_w}{Gear Ratio \times \eta_T}}\)
- \(\eta_t\) transmission (gear) efficiency
Angular velocity at wheel, \(\omega_w = {\dfrac{v}{r_w}}\)
- \(v\) instantaneous velocity
Angular velocity at motor, \(\omega_m = {\dfrac{\omega_w}{Gear Ratio}}\)
Power supplied by/to the motor, \(P = {\dfrac{T_m \times \omega_m}{\eta_m}}\)
- \(\eta_m\) motor efficiency
In the case of regenerative braking \(F_t\) would be negative and would be reduced by some factor, \(R\) which is the proportion of \(F_t\) used for regeneration and the rest used for braking.
The torque at the wheel in this case would be calculated as follows:
\[T_w = (F_t \times R) \times r_w\]Current Draw Method
Once we have the motor power requirements we can determine using the current draw method the amount of current that is drawn from the battery at every time step. Assuming the battery cells are connected in series, we can then determine the SoC by comparing the instantenous charge to the initial charge (1C capacity) (Larmine & Lowry, 2012).
We first determine the the current, \(I\) drawn from the battery when it is operating at power, \(P\) using the following equation:
\[P = V \times I\]If we subtitute the equation for the terminal voltage of a battery we get:
\[P = V \times I = (E-IR) \times I = EI-RI^2\]The quadratic solution for \(I\) is given by:
\[I = {\dfrac{E-\sqrt{E^2-4RP}}{2R}}\]- \(E\), Open Circuit Voltage (OCV)
- \(R\), Internal voltage of battery
- \(P\), Power required for the motor
Finally we can determine the depth of dischange (DoD, equal to 1-SoC) by simply taking the Amp hour capacity of the battery and subtracting the current for a given time step.
\[C_{n+1} = C_n - {\dfrac{\delta t \times I}{3600}}\]- \(C\), cumulative current drawn from the battery
- \(\delta t\), time step
- \(I\), current as caculated above
And finally, we can determine the DoD,
\[DoD = {\dfrac{C_{n+1}}{Cap}}\]- \(Cap\), 1C Amp hour capacity
Power Draw Method
The power draw method offers a simpler and more intutive way to determine an electric vehicle state of charge. Since vehicle battery packs are often described on the basis of \(kWh\) we can therefore draw down the the overall capacity by subtracting the amount of energy to move the verhicle at each time step.
We simply determine the power \(P\) in \(kWh\) supplied by or to the battery as shown above and multiply the timestep \(\delta t\) (Franca, 2015),
\[E = P \times {\dfrac{\delta t}{3600}}\]And SoC can then be calculated by the following:
\[SoC_{n+1} = SoC_n - {\dfrac{E}{Cap}}\]- \(Cap\), battery pack capacity in \(kWh\)
Which Method to Use?
The purpose of developing a model to simluate the operation of a electric vehicle as well as the power flow from the battery to traction is to approximate its performance. Depending on the use case there are advantages and disadvantages to either method. For rough approxmiations of energy use, the power draw method is easy to understand and implement. The incremental change in battery charge is implemented in terms of power units which translates effectively with how we think about battery capacity. However the current draw method offers more opportunity in simulating accurate results. Developing complex equivalent circuit and OCV models allows us to accurately predict how a cell will perform in various conditions. For the purposes of range or SoC simulation either method will give reasonable results. Try them out using Drivecycle.