Creating a Bus Drive Cycle Simulation
Drive cycles play an important role in determining the energy consumption of electric vehicles. Using OSM speed limit and intersection data along with bus stop locations, I created a tool that simulates drive cycles for bus routes in different transit networks. This information can help transit agencies understand the constaints when operating electric buses on existing routes.
 Drive cycle simulation tool using OSM data.
Over the past year, I’ve been leading a project to demonstrate the viability of battery electric buses for a transit agency. It got me thinking a lot about drive cycles. I wasn’t familiar with the term before but I’ve come to understand it’s importance in understanding power consumption in electric vehicles (EVs). Zero emissions buses (ZEBs), which include both Battery Electric and Fuel Cell Electric Buses, have taken the spotlight recently. Major federal funding announcement in both Canada and the United States have encouraged transit agencies and municipalities in North America to have a serious look at the viability of converting portions of their fleets to ZEBs.
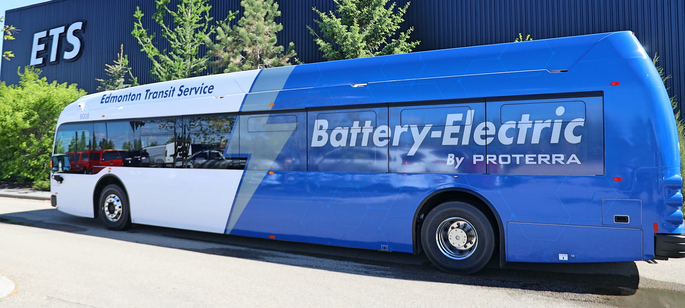 Edmonton Transit System (ETS) rolled out one of the largest electric bus deployments in Canada in 2020. Source: edmonton.ca
While there is no doubt about the environmental benefits of ZEBs through reduced GHG emissions there still some hesitation in widespread adoption because of range limitations. A typical 40ft, 350kWh bus may have a maximum range of 300km as compared to 350 to 500km for a diesel equivalent 1. Range anxiety is something that transit agencies are rightly concerned about. However, modelling and simulating energy consumption is one of the most important tools when it comes to estimating ZEB range. This information can be used as input for transit service planning and to accomodate infrastructure constraints2.
What is a Drive Cycle?
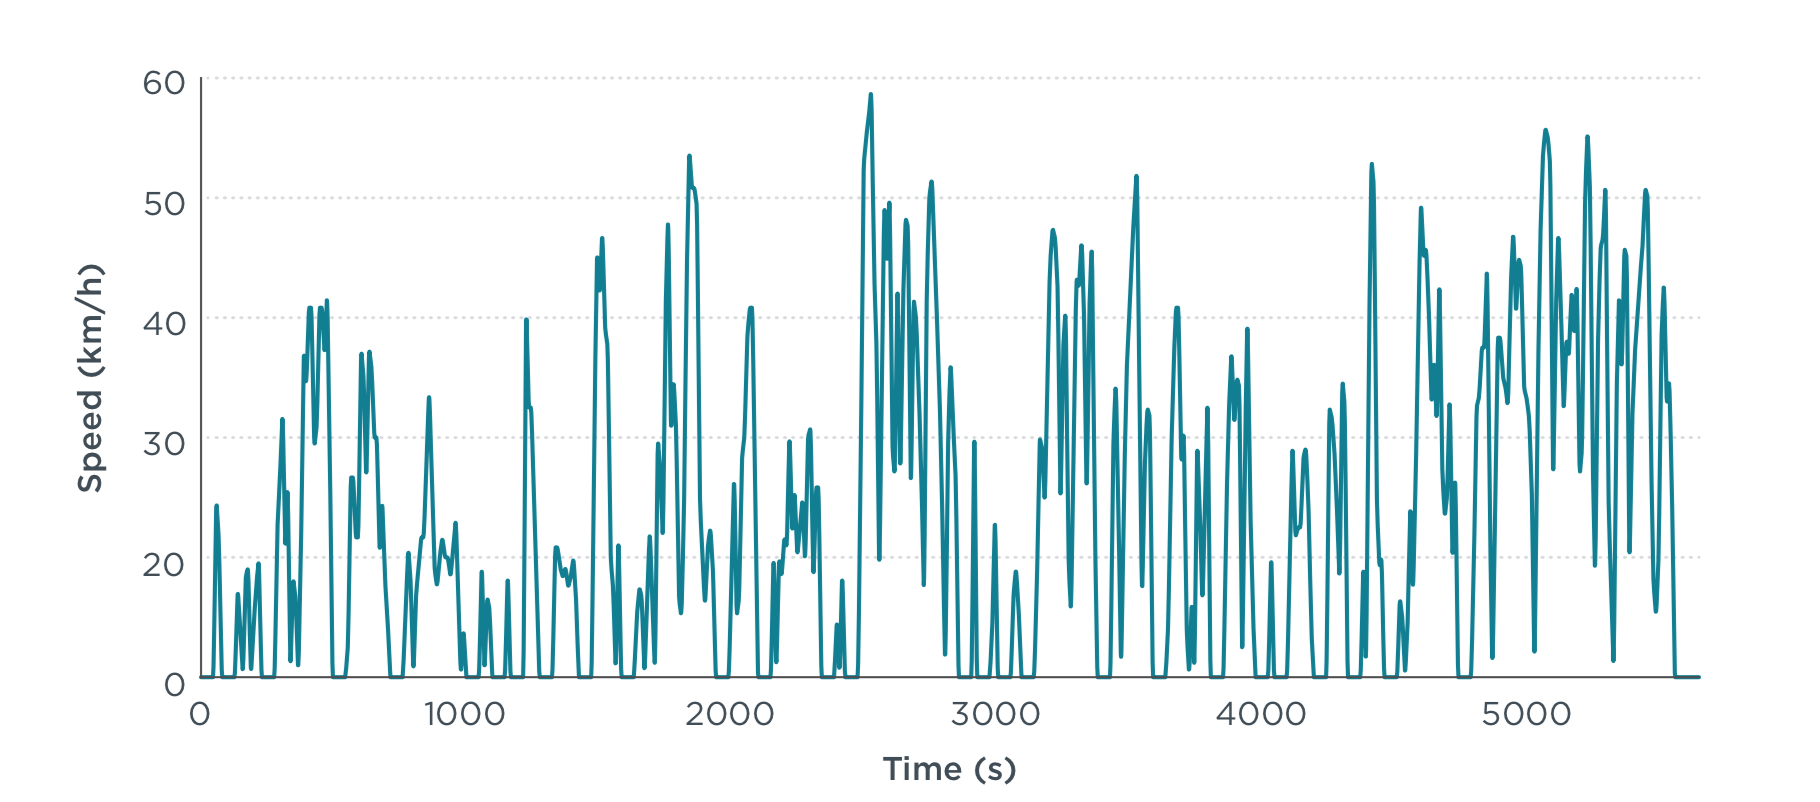 A bus drive cycle when plotting GPS data. (https://theicct.org/publications/zev-bus-fleets-dev-drive-cycles)
Drive cycles have traditionally been used in the automotive industry to test the performance of vehicles using standardized driving patterns. Think of a vehicle following a prescribed acceleration, speed, stop distance profile, maybe on a highway or in a city. This profile could be applied to any make of vehicles to provide a standardized way to measure performance, for example fuel economy or tailpipe emissions.
In an EV context, the drive cycle can play a more central role in gauging energy consumption of the vehicle or battery state of charge (SOC). By generating a simulated drive cycle of the vehicle’s trip, from origin to destination, and considering factors such as elevation change, driver behaviour or weather, we can estimate energy consumption.
For electric buses, transportation engineers and planners are able to generate representative drive cycles using actual GPS data and can use that data along with factors such as number of passengers on board to model the energy consumption of a route. But using this method depends on the availability of high quality GPS data and the ability to clean, aggregate and validate the data to create a representative drive cycle for a route.
I wanted to explore if there was a way to generalize a drive cycle using OSM speed limit data, OSM intersection nodes and stop locations in the absence GPS data. Would it be possible to use this drive cycle to determine a very rough estimation of energy consumption?
Creating a Drive Cycle
Finding resources on creating sample drive cycles using speeds, segment lengths or stop distances was a little more difficult than I expected. Besides often cited papers such as Akcelik and Biggs, which do a good job of modelling vehicles in traffic, I wanted a more generalized method to create a simple drive cycle. Ultimately, I found that trajectory planning was the most applicable method in creating drive cycles using different road factors such as speed and intersection and stop locations.
Drive cycle simulation for short length and only three stop 10 Van Horne route in Toronto
I used a combination of Transitland for getting route shapes and Valhalla routing engine to match the route shapes to OSM edges. Transitland, through their API, also includes linearly referenced stop locations for ever route trip. By combining the stop locations with the OSM edge data, I created a graph of edges and nodes which could be used to create a drive cycle.
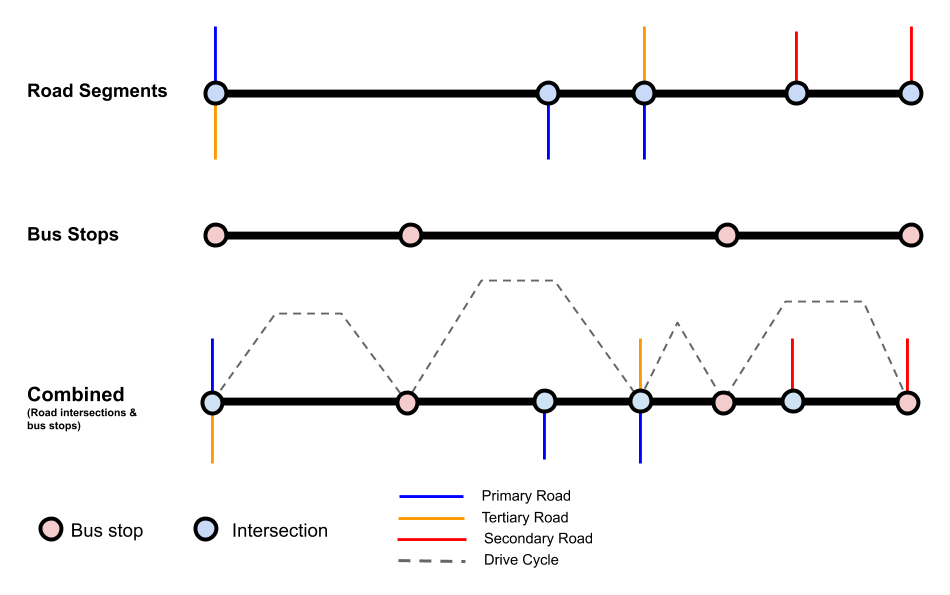 Combining linearly referenced stop location with intersection locations.
The trajectory planning algorithm I implemented was designed to stop at bus stop locations and nodes (intersections) that intersected with another tertiary road. To add some stochasticity to the stop points, the algorithm would assign a 50% chance that the bus would stop at either a bus stop or tertiary road intersection. I defined a maximum acceleration for the bus, and the target speeds for each road segment were obtained from OSM.
To make a more comprehensive tool to analyze a system wide collection of routes, I again tapped into the Transitland API to list all bus routes for a city, and along with Mapbox and D3, visualized the results.
Next Steps
The method that I implemented, offers a course approximation of drive cycle compared to a other methods that use GPS data. The absence of traffic data, driver behaviour or detailed vehicle specifications also greatly limits the accuracy of the simulation. Following more validation work of the drive cycles, my next step is to create a power consumption model to determine battery state of charge along a route.
References
- https://www.nap.edu/catalog/25842/guidebook-for-deploying-zero-emission-transit-buses
- https://theicct.org/publications/zev-bus-fleets-dev-drive-cycles